Tutorial: Visualize LDROBOT LD14P LiDAR Live Data in a Browser on Raspberry Pi (Python)
Turn the LD14P's raw distance data into a live polar radar you watch in any web browser — served straight from a headless Raspberry Pi with Flask. Part 3 of the LD14P + Raspberry Pi series.

This is Part 3 of our LDROBOT LD14P on Raspberry Pi series. Part 1 wired up the LiDAR and read live distance data; Part 2 controlled the motor. So far the data has only scrolled past as numbers. In this part we turn it into a live radar plot you watch in a web browser — served straight from the Pi, with no desktop, monitor, or VNC required.
All functionality in this article is now available as a Python
lds2dlibrary.
Headless-friendly: the Pi runs a tiny web server and you open the radar from your laptop or phone at
http://<pi-ip>:8080. No display attached to the Pi. Run with--demoto preview the plot even before your LiDAR arrives. Bug reports welcome on our support forum.
What we are building
A single file, ld14p_web.py, that does three things: reads the LiDAR over UART (reusing the stream() generator from Part 1), keeps the most recent full rotation in memory, and serves a small HTML page that draws the points as a polar “radar” on an HTML canvas. The browser asks the Pi for the latest scan about ten times a second, so the plot updates smoothly as you wave your hand in front of the sensor.
The whole thing is about 200 lines and has one new dependency, Flask. Grab it from the repo: ld14p_web.py.
Get new tutorials by email
Step 1 — install Flask
# install once (pyserial you already have from Part 1)
pip install flask
Flask is the lightweight web server that hands the radar page and the scan data to your browser. pyserial is the same library Part 1 used to read the serial port.
Step 2 — collect a full scan
The LD14P streams 12 measurement points per packet, sweeping continuously around the circle. To draw a complete picture we keep one distance value per whole degree and overwrite each bucket as fresh points arrive. A lock keeps the background reader and the web server from stepping on each other:
class ScanState:
    """Latest full 360-degree scan: one distance bucket per whole degree."""
    def __init__(self, bins=360):
        self.dist = [0] * bins         # millimetres, 0 = no return
        self.lock = threading.Lock()

    def update(self, angle_deg, dist_mm, intensity):
        i = int(angle_deg) % len(self.dist)
        with self.lock:
            self.dist[i] = dist_mm     # store 0 too, so points that vanish clear
Storing a zero when there is no return (rather than skipping it) means points that disappear — someone walks out of view — are cleared on the next sweep instead of lingering on the plot.
Step 3 — feed it from the Part 1 reader
Here is the payoff for the work we did in Part 1. The stream() generator already yields parsed (angle, distance, intensity) points, so the reader thread is tiny — it just pours those points into the scan buffer:
import ld14p_pi   # Part 1: the stream() generator does the parsing for us

def reader(state, port, baud):
    for speed_dps, _start, _end, _ts, points in ld14p_pi.stream(port, baud):
        state.rpm = speed_dps / 6.0          # deg/s -> rev/min
        for angle, dist, intensity in points:
            state.update(angle, dist, intensity)
That runs on a background thread while Flask serves two routes: / returns the radar page, and /scan returns the current points as JSON. The canvas in the page fetches /scan on a timer and redraws. The full Flask and JavaScript glue is in ld14p_web.py — it is short enough to read in one sitting.
Step 4 — run it and open the radar
# install once (pyserial you already have from Part 1)
pip install flask

# real LiDAR on the Pi GPIO serial port
python3 ld14p_web.py

# a USB-to-serial adapter instead?
python3 ld14p_web.py /dev/ttyUSB0

# no LiDAR wired up yet? preview the radar with synthetic data
python3 ld14p_web.py --demo
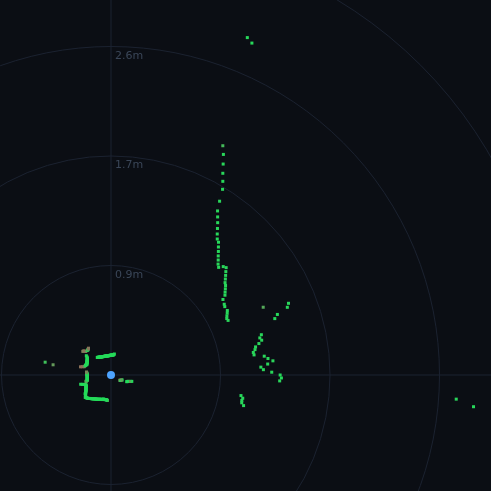
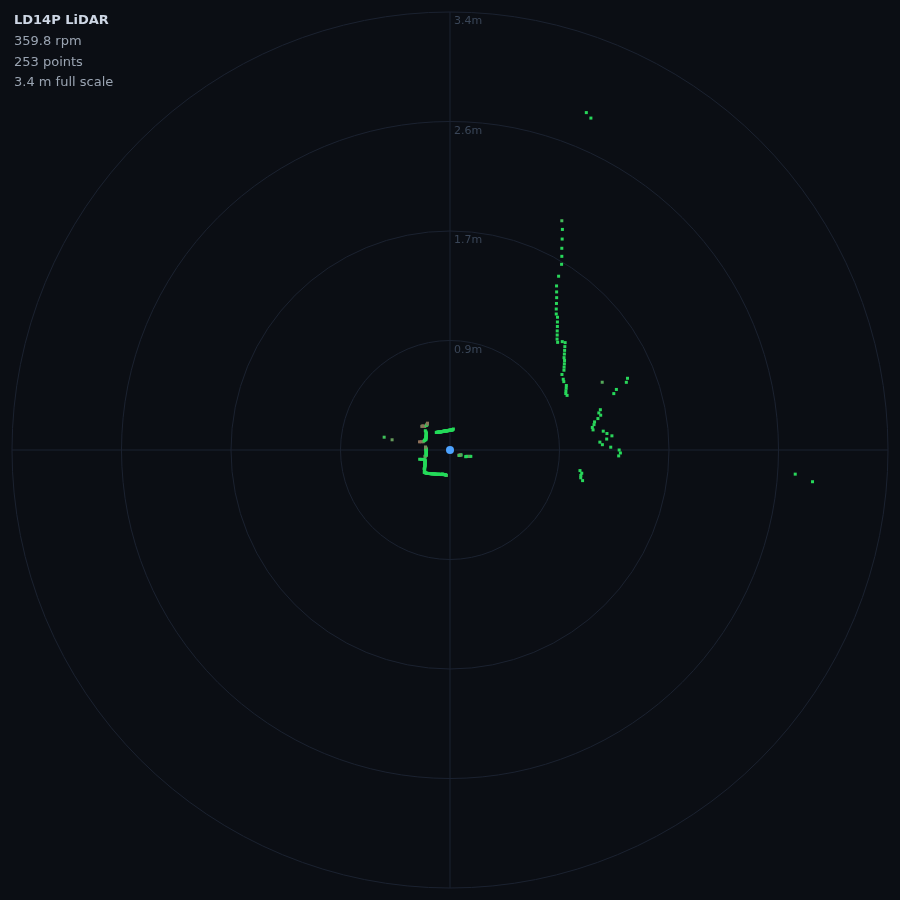
Then point a browser on the same network at http://<pi-ip>:8080/ — for example http://raspberrypi.local:8080/. You should see a dark radar with range rings, the Pi at the centre, and a ring of points tracing the walls around your sensor. Wave a hand in front of the LiDAR and watch the points move in real time.
No hardware yet? python3 ld14p_web.py --demo serves a synthetic room so you can see exactly what the finished plot looks like before your LD14P arrives.
How LiDARs are used in self-driving robots?
Build a real LiDAR self-driving Arduino/ROS2 robot using our kit - with complete step-by-step instructions. No robotics experience necessary.
See the full robot kit →Reading the plot
- Distance is the radius — points near the edge are far away, points near the centre are close.
- Range rings are labelled in metres and auto-scale to the farthest point in the current scan.
- Colour follows signal intensity: brighter green means a stronger return, which usually means a closer or more reflective surface.
- The blue dot in the middle is the LiDAR itself.
Where this is going
A live radar is the bridge between “numbers on a screen” and a robot that understands its surroundings. The same scan buffer feeds obstacle detection, and the same data, published to ROS 2 as a LaserScan, is what SLAM uses to build a map. That ROS 2 bridge is the natural next step in this series.
The LD14P used here is available in our store: LDROBOT LD14P LiDAR. All the code for this series lives in the rpi5_ldrobot_ld14p repository and is released under the Apache 2.0 license.